PearGRN
PearGRN consolidates co-expression, TF-target, non-coding RNA, 3D-genome and protein-interaction networks of pear (Pyrus) into one resource — for retrieving regulatory relationships, exploring expression dynamics and prioritising candidate genes behind breeding traits.
Introduction
PearGRN (Pear Integrative Gene Regulatory Network Database) is a comprehensive resource designed to consolidate various omics regulatory networks, facilitating the retrieval of gene regulatory relationships and protein interactions. It provides a platform to predict key genes associated with important breeding-related traits.
The database offers several tools including BLAST, Expression, JBrowse, Gene Search, Node Search, Network Creation, Network Comparison, TF Regulation, Interact Finder, TraitConnect and ML Predictor, making it an essential resource for researchers in pear genetics and genomics.
PearGRN is hosted by the Center of Pear Engineering Technology Research at Nanjing Agricultural University and aims to support advanced genetic research and breeding projects in pears.
Network Gallery
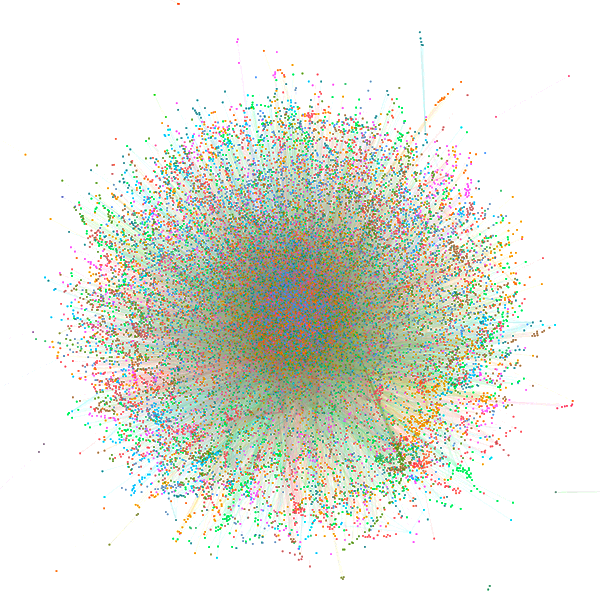
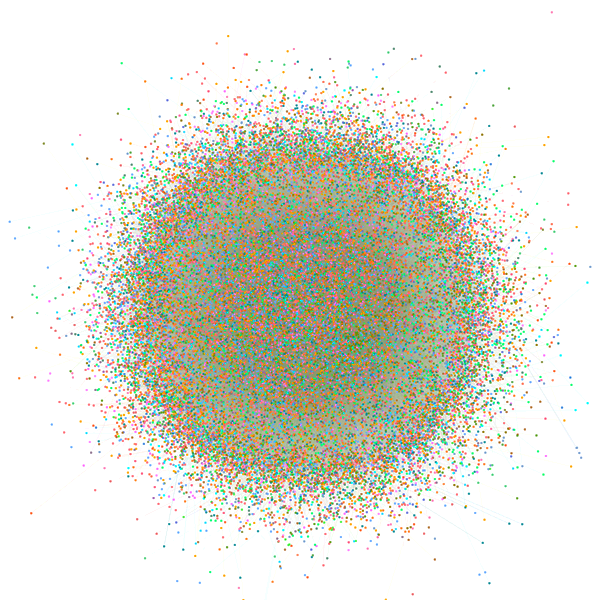
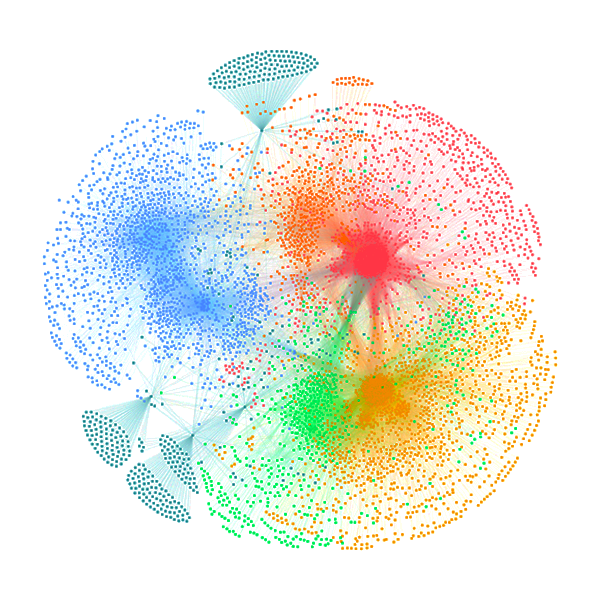
Four representative views of the resource — open any of them in the interactive network viewer.

Network Information
Topological properties of all 15 networks. Click a column header to sort.
| Network | Nodes | Edges | TFs | Genes | Transitivity | Avg. distance | Modules | Hub genes |
|---|---|---|---|---|---|---|---|---|
| High Confidence Coexpression Network | 22,175 | 637,942 | 1,937 | 20,238 | 0.334 | 3.970 | 1,401 | 2,217 |
| Moderate Confidence Coexpression Network | 27,881 | 1,284,858 | 2,071 | 25,810 | 0.191 | 2.811 | 1,415 | 2,780 |
| Low Confidence Coexpression Network | 29,913 | 2,111,196 | 2,204 | 27,709 | 0.160 | 2.533 | 1,495 | 2,991 |
| Non-coding RNA Network | 25,700 | 1,626,783 | 1,776 | 23,924 | 0.800 | 5.244 | 929 | 2,484 |
| 3D Inter Network | 3,032 | 5,237 | 214 | 2,818 | 0.019 | 2.594 | 228 | 261 |
| 3D Intra Network | 8,591 | 16,743 | 637 | 7,954 | 0.045 | 3.754 | 559 | 805 |
| 3D Genome Network | 10,964 | 21,980 | 793 | 10,171 | 0.050 | 4.552 | 737 | 1,059 |
| ATAC-seq-based TF-target Regulatory Network | 9,717 | 194,238 | 1,094 | 8,623 | 0.012 | 2.510 | 22 | 956 |
| PWM-based TF-target Regulatory Network | 39,473 | 395,509 | 2,908 | 36,565 | 0.004 | 2.606 | 101 | 3,799 |
| TF-target Regulatory Network | 40,005 | 567,927 | 2,924 | 37,081 | 0.006 | 2.498 | 29 | 3,830 |
| Pcorr Network | 2,304 | 269,130 | 209 | 2,095 | 1.000 | 1.000 | 21 | 492 |
| cPPI Network | 6,790 | 64,003 | 723 | 6,067 | 0.117 | 3.434 | 269 | 670 |
| Interactome Network | 8,666 | 333,115 | 860 | 7,806 | 0.944 | 3.312 | 262 | 825 |
| Structure-based PPI Network | 14,765 | 195,350 | 1,911 | 12,854 | 0.399 | 4.233 | 732 | 1,468 |
| Integrative Network | 45,678 | 3,157,357 | 2,979 | 42,699 | 0.260 | 2.572 | 597 | 4,564 |
Tools
Sixteen integrated tools for annotation, network analysis and structural biology.
 Gene Search
Annotation for genes, lncRNAs, circRNAs and miRNAs.
Gene Search
Annotation for genes, lncRNAs, circRNAs and miRNAs.
 GO Finder
Find genes sharing GO terms, with any / all matching.
GO Finder
Find genes sharing GO terms, with any / all matching.
 RNA Expression
Temporal expression across pear fruit development.
RNA Expression
Temporal expression across pear fruit development.
 Proteome Expression ↗
Protein abundance across tissues and stages.
Proteome Expression ↗
Protein abundance across tissues and stages.
 JBrowse
Gene models and variants along the pear genome.
JBrowse
Gene models and variants along the pear genome.
 BLAST
Align sequences against the pear genome and proteome.
BLAST
Align sequences against the pear genome and proteome.
 Node Search
All regulatory partners of a gene across networks.
Node Search
All regulatory partners of a gene across networks.
 Network Creation
Build a sub-network from your own gene list.
Network Creation
Build a sub-network from your own gene list.
 Network Comparison
Compare topology and shared edges between networks.
Network Comparison
Compare topology and shared edges between networks.
 TF Regulation
Transcription factor – target relationships.
TF Regulation
Transcription factor – target relationships.
 Interact Finder
Proteins interacting with your protein of interest.
Interact Finder
Proteins interacting with your protein of interest.
 TraitConnect
Link traits to candidate genes via the networks.
TraitConnect
Link traits to candidate genes via the networks.
 ML Predictor
Machine-learning gene–trait association prediction.
ML Predictor
Machine-learning gene–trait association prediction.